This project encompasses a series of smaller experiments, each created to test and learn different algorithms, techniques, and more.
You can find the repository containing all experiments on github.com.
Empire Cellular Automaton
This project simulates a cellular automaton, inspired by the concept popularized by Conway’s Game of Life. The automaton, named “Empire,” is based on the work of Hopson97’s Empire. It simulates a world of land and water tiles inhabited by multiple colonies, each with individuals possessing unique attributes like strength, age, and reproduction value.
The simulation operates under specific rules, with individuals moving, fighting, reproducing, or dying based on predefined conditions. Despite attempts to balance the system, exponential population growth often overwhelmed computational resources, leading to a global cap of 1,000 individuals. The outcomes of these simulations were visualized through graphs and datasets.
Key Features:
- Individuals represented by attributes: age, strength, reproduction value, and more.
- Movement and combat rules for interactions between individuals and colonies.
- Implementation optimizations using NumPy arrays and multiprocessing.
Fig 1. First Simulation
Fig 2. People Distribution Map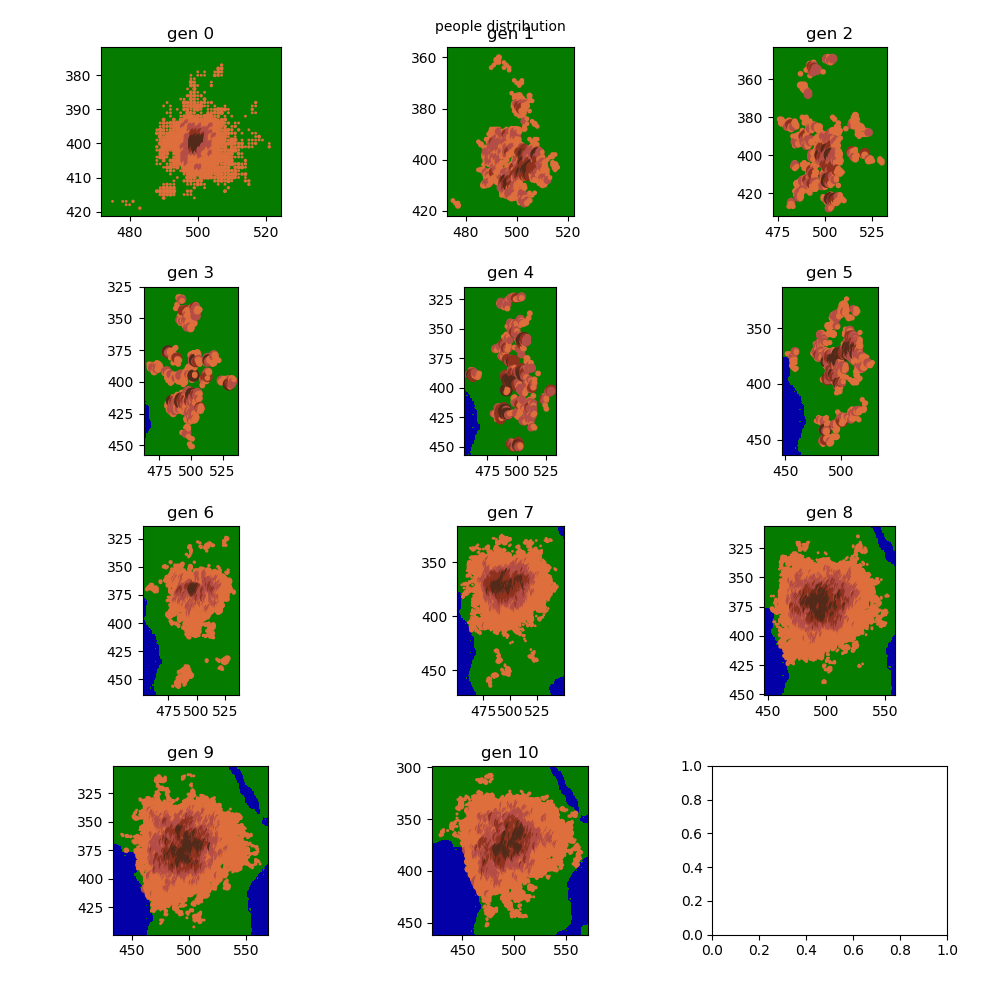
Additional Datasets and graphs
See the Rules
Rules:
The world is made up of pixels that represent people
Each person has the following attributes:
Age
Strength
Reproduction value
Setup:
Each colony begins at a different location on the map
100 people are placed around this point
Start of the simulation
age and reproduction value increase
If the age is greater than the strength, the person dies
Person tries to go to a random pixel around him
- Winner will be chosen randomly
- The one with the higher strength has a greater chance of winning in proportion to his strength
When she tries to go to water, nothing happens
If she tries to go to a field of another colony, both persons fight
When she tries to go to an empty land pixel, she goes there
If the reproduction value exceeds a maximum limit, the person reproduces
- The child receives the strength and the reproduction value of the parent +/- a random number from 0 to 10
The child receives the age of 0
mutations
100 years are simulated per generation:
Each year, each person does the following:
Optimization Details
NumPy-Array
Transitioned from Python objects to a single NumPy array for efficiency, enabling matrix operations to manipulate data.
Example structure:
| |
Multiprocessing
Parallelized calculations of new generations to enhance performance.
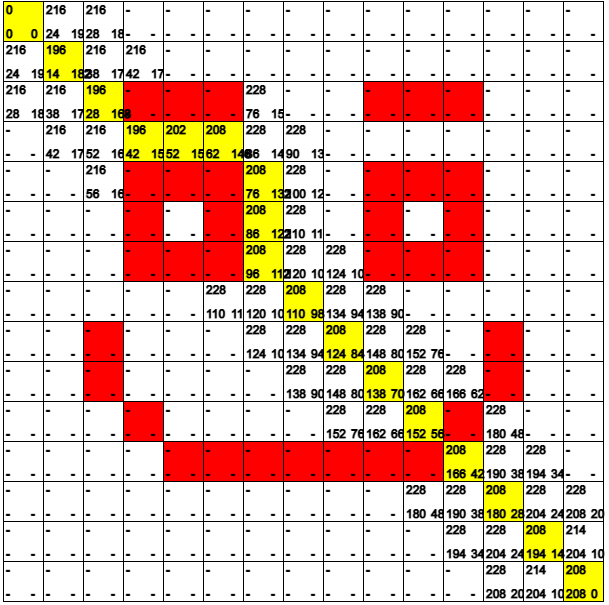
Fig 3. Optimization using NumPy
Raycasting
A simple 3D renderer built using raycasting. The left side shows a top-down view, while the right side visualizes the rendered 3D perspective. Players can control a point representing the user, with the rendered image updating in real-time.
Fig 4. Raycasting Visualization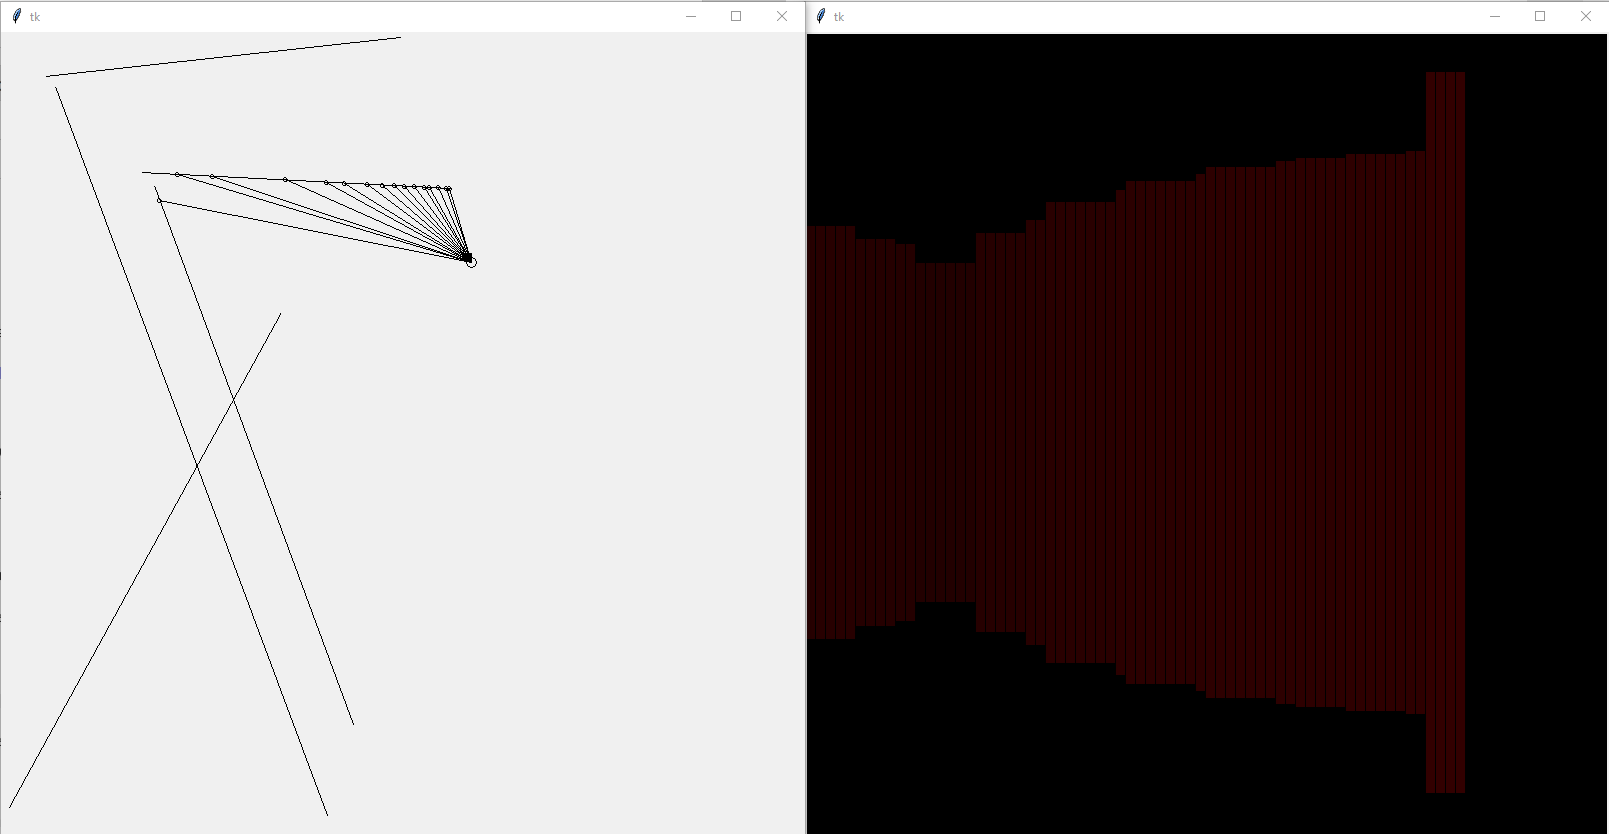
Mandelbrot Set
A browser-based implementation of the Mandelbrot set in JavaScript. It includes a color smoothing function and zoom capabilities.
Learn more about the Mandelbrot Set here.
Fig 5. Rendered Visualization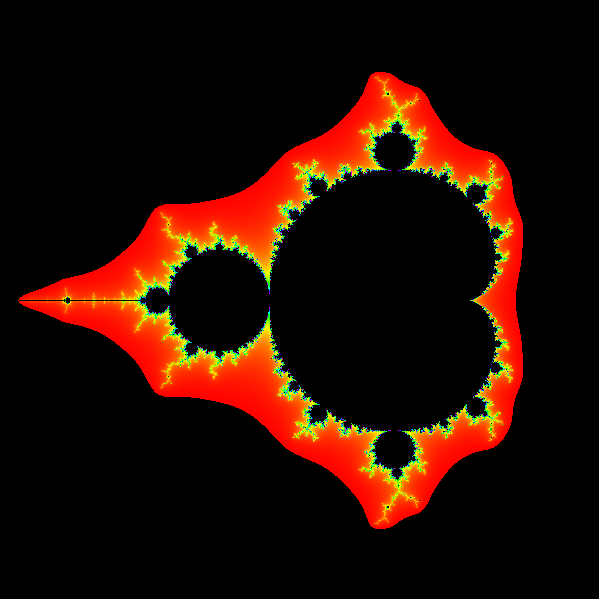
Fig 6. Simulation
Rolling Shutter Effect
Inspired by the animations of the rolling shutter effect, this project recreates the phenomenon where an image is captured line-by-line over time. The challenge involved animating graphs with Matplotlib and implementing mathematical transformations like rotating shapes.
Learn more about the rolling shutter effect here.
Fig 7. Rolling Shutter Effect Visualized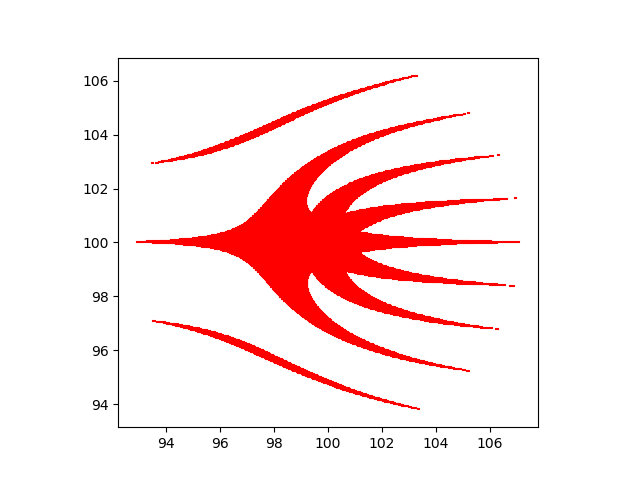
Fig 8. Rolling Shutter Effect Creation
A* Pathfinding Algorithm
An implementation of the A* pathfinding algorithm visualized using p5.js. The simulation distinguishes between passable tiles, walls, and the calculated path. Each tile displays its current and estimated costs for better understanding.
Fig 9. A* Visualization